Remediation Guide
This guide covers the RemediationPolicy CRD for event-driven remediation using the DevOps AI Toolkit.
Overview
The RemediationPolicy CRD monitors Kubernetes events and forwards them to the DevOps AI Toolkit MCP for analysis and remediation. It supports:
- Event Watching: Configurable filtering of Kubernetes events by type, reason, and involved objects
- Automatic Mode: System detects, analyzes, and fixes issues without human intervention
- Manual Mode: System detects and analyzes issues, provides recommendations via Slack for humans to execute
- Slack Notifications: Rich notifications with remediation results and next steps
- Rate Limiting: Prevents event storms with configurable cooldowns
- Status Reporting: Comprehensive observability through status updates
Prerequisites
- Controller installed (see Setup Guide)
- DevOps AI Toolkit MCP installed - See DevOps AI Toolkit documentation
- Slack webhook URL (optional, for Slack notifications)
- Google Chat webhook URL (optional, for Google Chat notifications - requires Google Workspace paid account)
Create a RemediationPolicy
Create a RemediationPolicy to start processing events:
# Create a Secret containing your MCP auth token (required for Kubernetes deployments)
# Use the same token configured in the MCP server's DOT_AI_AUTH_TOKEN environment variable
kubectl create secret generic dot-ai-secrets \
  --from-literal=auth-token="your-mcp-auth-token" \
  --namespace dot-ai

# Create a Secret containing your Slack webhook URL (optional, for notifications)
kubectl create secret generic slack-webhook \
  --from-literal=url="https://hooks.slack.com/services/YOUR/WEBHOOK/URL" \
  --namespace dot-ai

# Apply the policy
kubectl apply --filename - <<EOF
apiVersion: dot-ai.devopstoolkit.live/v1alpha1
kind: RemediationPolicy
metadata:
  name: sample-policy
  namespace: dot-ai
spec:
  # Multiple event selectors with different configurations
  # NOTE: Controller checks selectors in order and processes event on FIRST match
  eventSelectors:
    # Monitor pod scheduling failures - AUTOMATIC remediation
    - type: Warning
      reason: FailedScheduling
      involvedObjectKind: Pod
      mode: automatic                 # Safe to automatically fix scheduling issues
      confidenceThreshold: 0.85       # High confidence required for infrastructure changes
      maxRiskLevel: medium            # Allow medium-risk actions for infrastructure fixes

    # Monitor ALL remaining Warning events for ANY resource - MANUAL mode
    - type: Warning
      reason: ""                      # Empty = wildcard, matches ANY event reason
      involvedObjectKind: ""          # Empty = wildcard, matches ANY resource type

  # MCP endpoint using internal service URL
  mcpEndpoint: http://dot-ai-mcp.dot-ai.svc.cluster.local:3456/api/v1/tools/remediate
  mcpAuthSecretRef:                   # MCP authentication (required)
    name: dot-ai-secrets              # Secret name (must be in same namespace)
    key: auth-token                   # Key within the Secret containing the auth token
  mcpTool: remediate

  # Manual mode as global default (conservative approach)
  mode: manual

  # Global automatic mode configuration (used when mode=automatic)
  confidenceThreshold: 0.8            # Require 80% confidence for automatic actions
  maxRiskLevel: low                   # Only allow low-risk automatic actions by default

  # Conservative rate limiting for production
  rateLimiting:
    eventsPerMinute: 5                # Lower rate for production safety
    cooldownMinutes: 15               # Longer cooldown to prevent spam

  # Slack notifications configuration
  notifications:
    slack:
      enabled: true                    # Enable Slack notifications
      webhookUrlSecretRef:             # Reference to Secret containing webhook URL
        name: slack-webhook            # Secret name (must be in same namespace)
        key: url                       # Key within the Secret
      channel: "#alerts"               # Channel where notifications will be sent
      notifyOnStart: true              # Notify when remediation starts
      notifyOnComplete: true           # Notify when remediation completes
EOF

# Verify the policy was created
kubectl get remediationpolicies --namespace dot-ai
Understanding Remediation Modes
Automatic Mode
The system detects, analyzes, and fixes issues without human intervention.
Use when:
- Issues are low-risk and well-understood
- Fast remediation is critical
- You have high confidence thresholds configured
Safety controls:
confidenceThreshold: Minimum confidence (0.0-1.0) required for executionmaxRiskLevel: Maximum risk level allowed (low,medium,high)
Manual Mode
The system detects and analyzes issues, then provides remediation recommendations via Slack for humans to execute.
Use when:
- Issues require human judgment
- Changes affect production systems
- You want approval before execution
Workflow:
- Controller detects event
- MCP analyzes issue and generates recommendations
- Slack notification sent with specific kubectl commands
- Human reviews and executes commands when ready
Example 1: Manual Remediation
Let's test manual remediation by creating a memory-constrained application that will trigger OOMKilled warnings:
# Create a test namespace
kubectl create namespace memory-demo

# Create a memory-hungry application with insufficient memory limits
kubectl apply --filename - <<'EOF'
apiVersion: apps/v1
kind: Deployment
metadata:
  name: memory-hungry-app
  namespace: memory-demo
spec:
  replicas: 1
  selector:
    matchLabels:
      app: memory-hungry
  template:
    metadata:
      labels:
        app: memory-hungry
    spec:
      containers:
      - name: app
        image: ghcr.io/distroless/busybox:latest
        command: ["/bin/sh"]
        args: ["-c", "dd if=/dev/zero of=/tmp/memory.tmp bs=1M count=200; sleep 3600"]
        resources:
          limits:
            memory: "64Mi"
          requests:
            memory: "32Mi"
EOF

# Check the pod status (should show OOMKilled restarts)
kubectl get pods --selector app=memory-hungry --namespace memory-demo

# View the Warning events
kubectl get events --namespace memory-demo --field-selector type=Warning,reason=BackOff

# Check controller logs to see event processing
kubectl logs --selector app.kubernetes.io/name=dot-ai-controller --namespace dot-ai --tail 20
What Happens in Manual Mode
- Event Detection: The controller detects Warning events for container restarts due to OOMKilled
- Policy Matching: Matches the second event selector (wildcard Warning + manual mode from global policy)
- MCP Analysis: The system analyzes the issue and generates specific remediation commands
- Slack Notification: Sends detailed notification with:
- Problem analysis and root cause
- Recommended commands to fix the issue (e.g.,
kubectl patch deployment...to increase memory limits) - Step-by-step remediation instructions
- Human Decision: Users can:
- Execute the recommended kubectl commands directly
- Apply changes to YAML files in Git (GitOps workflow)
- Modify Helm values and redeploy
- Use any other approach they prefer
Key Difference: In manual mode, the controller gets remediation recommendations and forwards them to Slack, but never executes the commands. Humans review the recommendations and decide how/when to implement them.
Slack Notification - Manual Remediation Started:
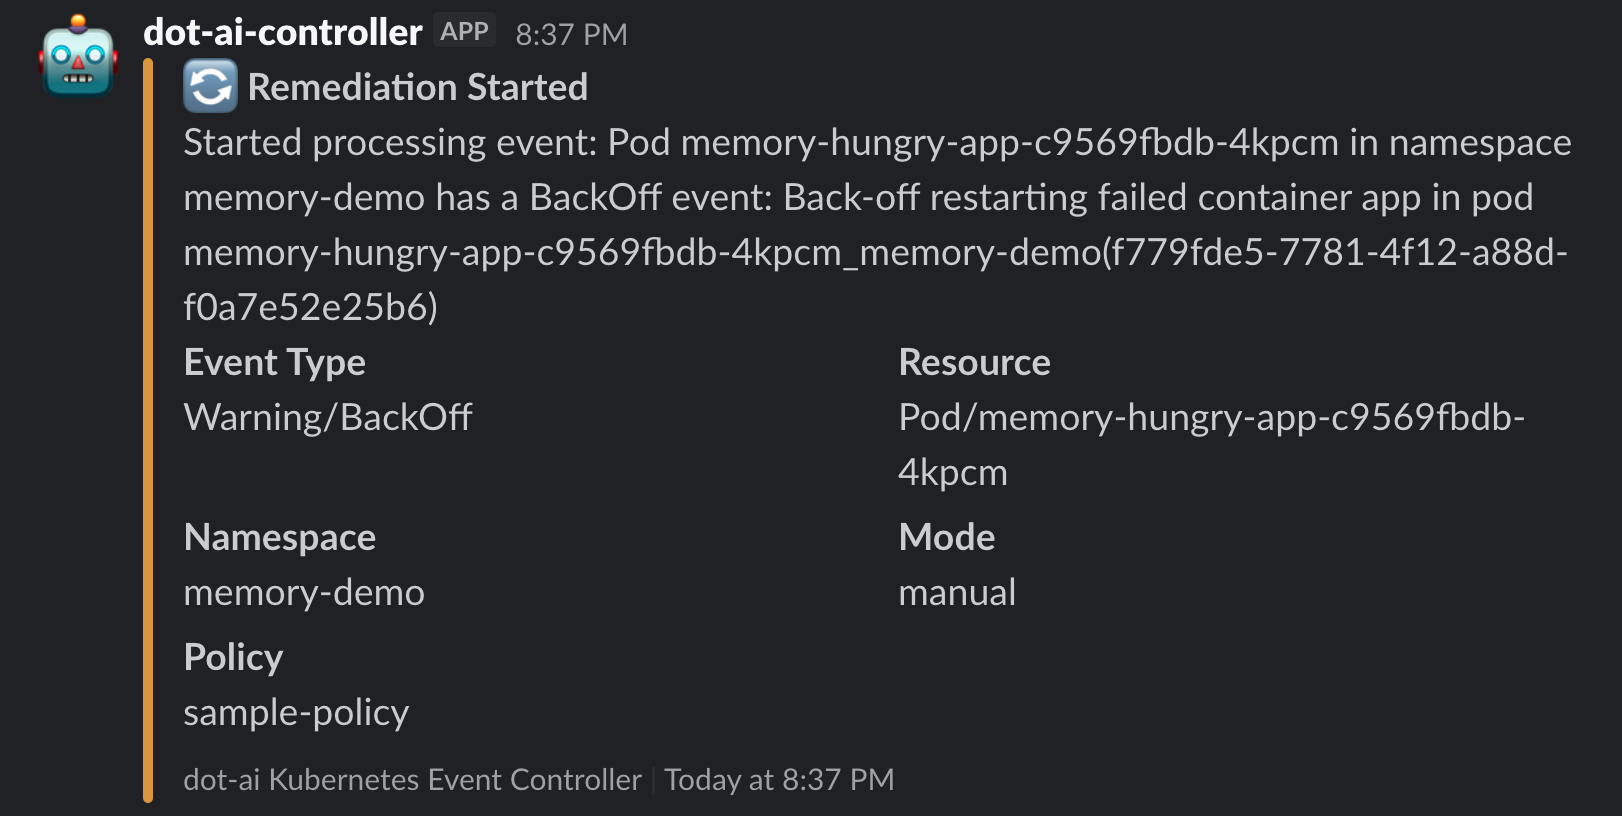
Manual Remediation Analysis Results
The analysis completed successfully, providing detailed recommendations without executing them:
Slack Notification - Manual Analysis Completed:
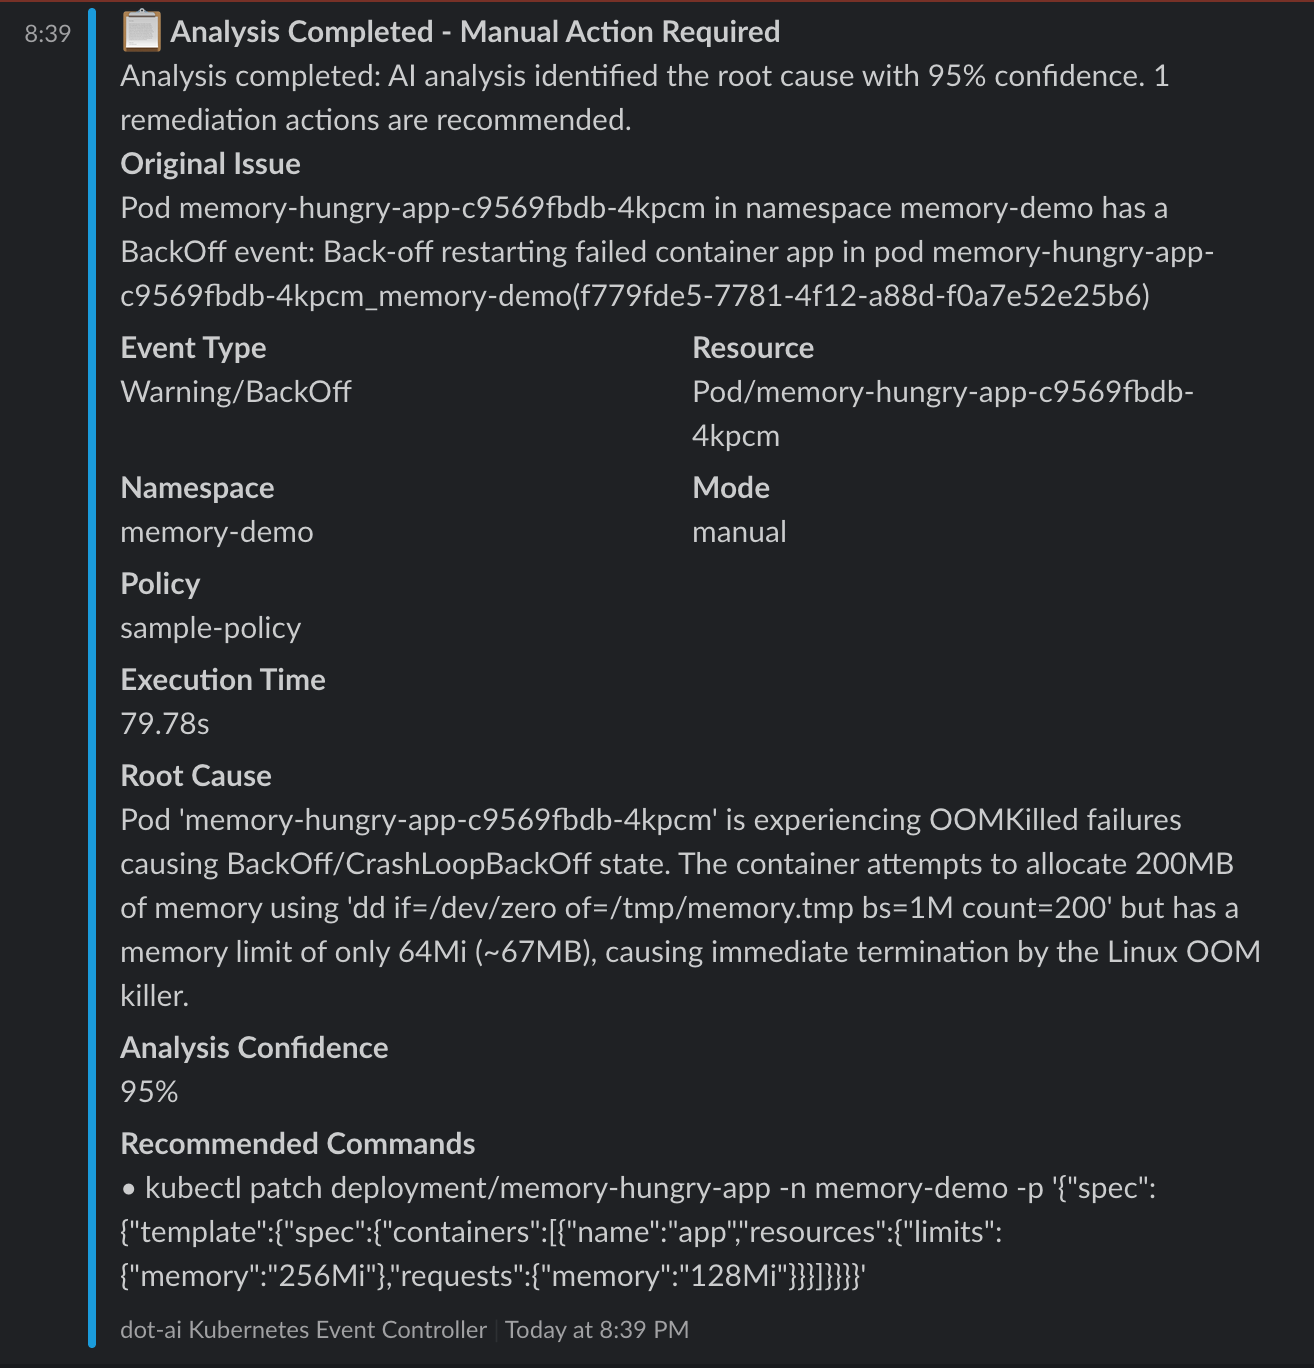
Manual Mode Results:
- Analysis Confidence: 95%
- Execution Time: 79.78 seconds
- Root Cause: Container attempts to allocate 200MB but has 64Mi limit, causing OOMKilled failures
- Recommended Action: Specific
kubectl patchcommand to increase memory limits to 256Mi with requests of 128Mi - Human Decision Required: The system provides the exact command but waits for human execution
Users can now execute the recommended command:
kubectl patch deployment/memory-hungry-app -n memory-demo -p '{"spec":{"template":{"spec":{"containers":[{"name":"app","resources":{"limits":{"memory":"256Mi"},"requests":{"memory":"128Mi"}}}]}}}}'
Example 2: Automatic Remediation
Now let's test automatic remediation with a real scenario - a PostgreSQL deployment that fails due to a missing PersistentVolumeClaim:
# Create a test namespace
kubectl create namespace postgres-demo

# Deploy PostgreSQL without creating the required PVC (this will cause FailedScheduling)
kubectl apply --namespace postgres-demo --filename - <<'EOF'
apiVersion: apps/v1
kind: Deployment
metadata:
  name: postgres-db
spec:
  replicas: 1
  selector:
    matchLabels:
      app: postgres
  template:
    metadata:
      labels:
        app: postgres
    spec:
      containers:
      - name: postgres
        image: postgres:13
        env:
        - name: POSTGRES_PASSWORD
          value: testpass
        - name: POSTGRES_DB
          value: testdb
        volumeMounts:
        - name: postgres-storage
          mountPath: /var/lib/postgresql/data
      volumes:
      - name: postgres-storage
        persistentVolumeClaim:
          claimName: postgres-pvc
EOF

# Check the pod status (should be Pending)
kubectl get pods --namespace postgres-demo

# View the Warning events that will trigger remediation
kubectl get events --namespace postgres-demo --field-selector type=Warning

# Check controller logs to see event processing
kubectl logs --selector app.kubernetes.io/name=dot-ai-controller --namespace dot-ai --tail 20
What Happens in Automatic Mode
- Event Detection: The controller detects the
FailedSchedulingWarning event - Policy Matching: Matches the first event selector (FailedScheduling + Pod + automatic mode)
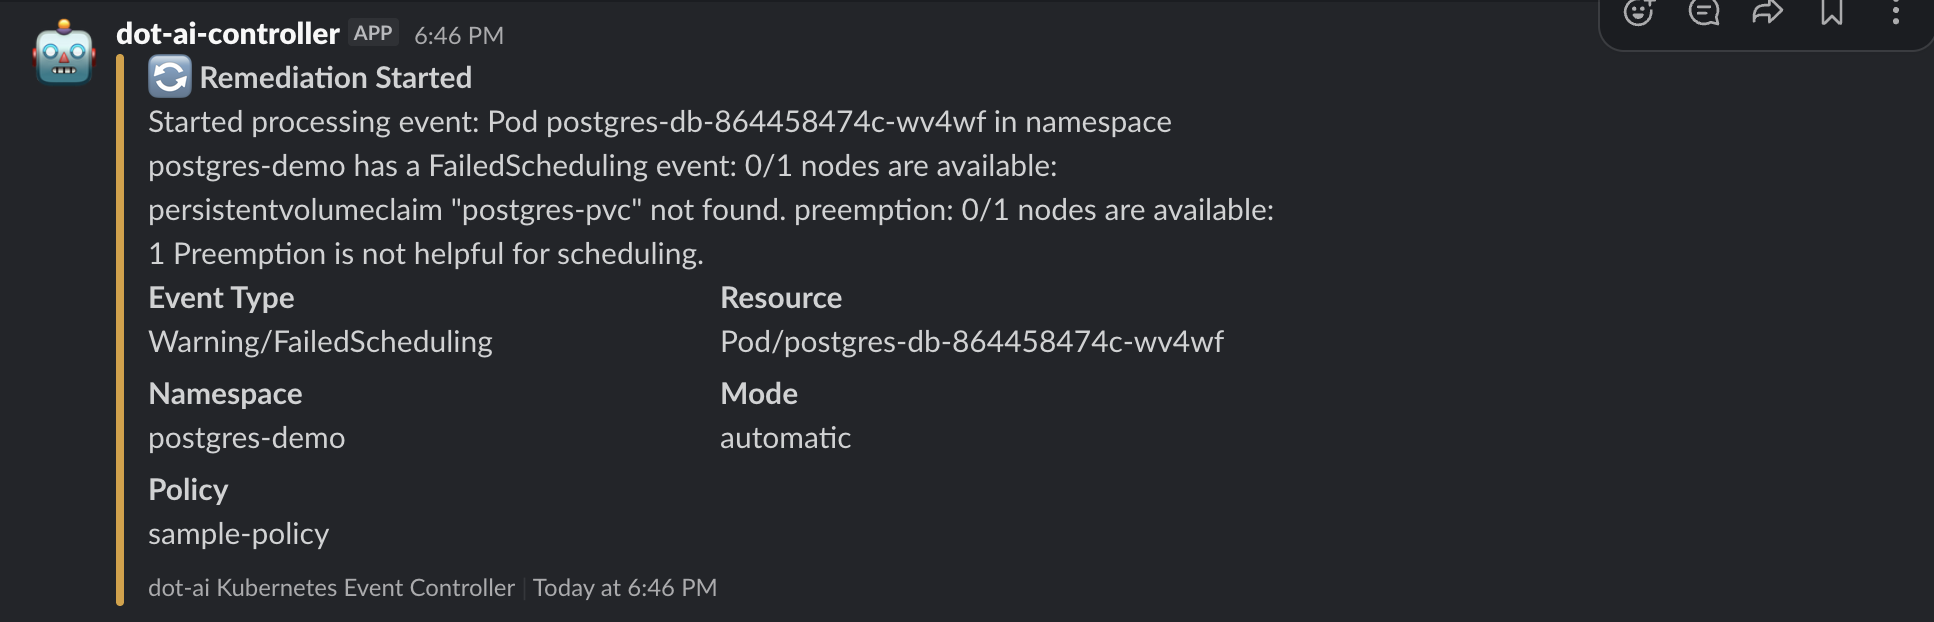
- Slack Notification: Sends "Remediation Started" notification with:
- Event details (Warning/FailedScheduling)
- Resource info (Pod/postgres-db-...)
- Namespace (postgres-demo)
- Mode (automatic)
- Policy (sample-policy)
- MCP Request: Sends automatic remediation request with:
- High confidence threshold (0.85)
- Medium risk level allowed
- Detailed event description
Slack Notification - Remediation Started:
Automatic Remediation Success
The system automatically resolved the issue! Here's what happened:
# The missing PVC was automatically created
kubectl get pvc --namespace postgres-demo

# The pod is now running successfully
kubectl get pods --namespace postgres-demo

# Check the remediation success event
kubectl get events --namespace dot-ai --field-selector reason=McpRequestSucceeded
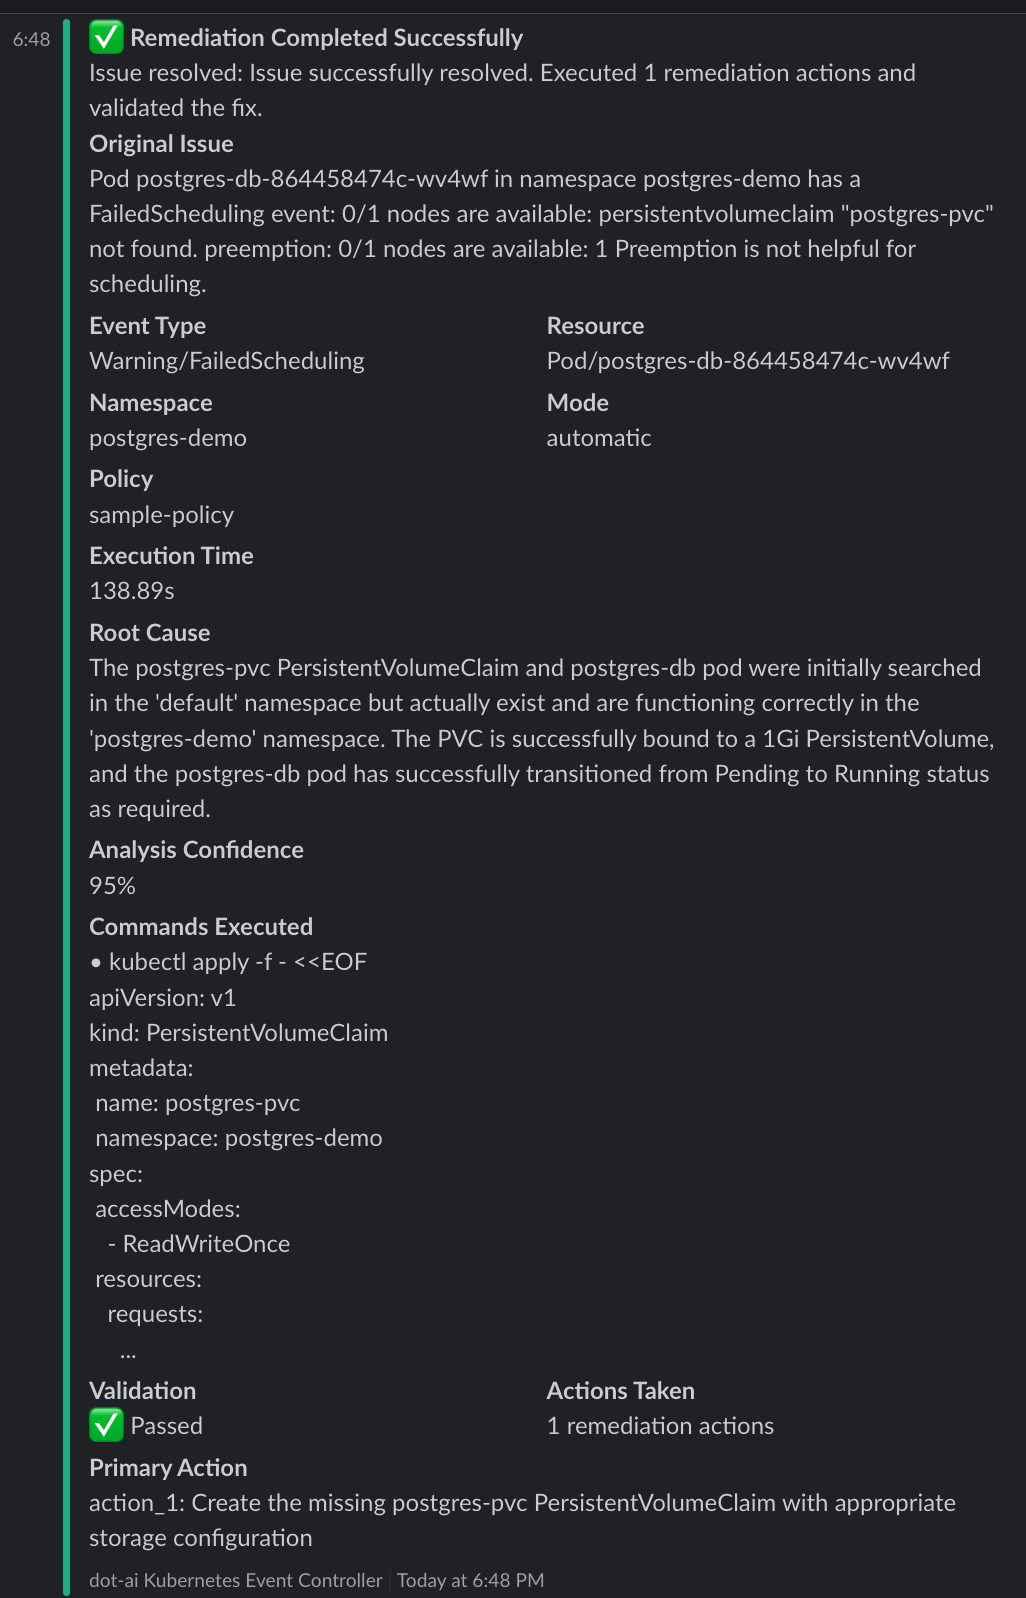
Remediation Results:
- Execution Time: 138.89 seconds
- Analysis Confidence: 95%
- Actions Taken: 1 remediation action
- Validation: ✅ Passed - Pod transitioned from Pending to Running
- Root Cause: The postgres-pvc PersistentVolumeClaim was missing from the postgres-demo namespace
- Solution: Automatically created the missing PVC with appropriate storage configuration
What the System Did:
- Analyzed the FailedScheduling event and identified the missing PersistentVolumeClaim
- Created the postgres-pvc PersistentVolumeClaim in the postgres-demo namespace with:
- 1Gi capacity
- ReadWriteOnce access mode
- Standard storage class
- Validated the fix by confirming the pod moved from Pending to Running status
This demonstrates the power of automatic remediation - the system detected, analyzed, fixed, and validated the issue without human intervention, all while maintaining safety through confidence thresholds and risk levels.
Slack Notification - Remediation Completed:
RemediationPolicy Configuration
Event Selectors
Event selectors filter which Kubernetes events trigger remediation:
eventSelectors:
  # Specific event type
  - type: Warning                    # Event type: Warning, Normal
    reason: FailedScheduling         # Specific event reason
    involvedObjectKind: Pod          # Resource type: Pod, Deployment, etc.
    namespace: production            # Optional: specific namespace
    mode: automatic                  # Override global mode for this selector

  # Wildcard selector (matches everything)
  - type: Warning
    reason: ""                       # Empty = matches ANY reason
    involvedObjectKind: ""           # Empty = matches ANY resource type
Important: Selectors are evaluated in order. The first matching selector's configuration is used.
Message Filtering
Filter events based on message content using regex patterns:
eventSelectors:
  - type: Warning
    reason: BackOff
    message: "pulling image.*nginx"     # Regex pattern to match event message
Pattern Syntax: Uses Go regex syntax (RE2). Common patterns:
.*- Match any characters^- Start of string$- End of string(?i)- Case-insensitive flag[0-9]+- One or more digits
Examples:
# Match specific image pull failures
eventSelectors:
  - type: Warning
    reason: BackOff
    message: "Failed to pull image.*postgres"

# Match any error code in message
eventSelectors:
  - type: Warning
    message: "error code [0-9]+"

# Case-insensitive matching for timeout messages
eventSelectors:
  - type: Warning
    message: "(?i)timeout"

# Match OOMKilled messages
eventSelectors:
  - type: Warning
    reason: BackOff
    involvedObjectKind: Pod
    message: "Container.*was OOMKilled"

# Combine filters - match BackOff events with specific messages
eventSelectors:
  - type: Warning
    reason: BackOff
    involvedObjectKind: Pod
    namespace: preprod
    message: "Back-off.*pulling image"
    mode: manual
    confidenceThreshold: 0.85
    maxRiskLevel: medium
Wildcard: Empty or omitted message field matches all events (no message filtering).
Mode Configuration
# Global default mode
mode: manual                         # manual or automatic

# Per-selector override
eventSelectors:
  - type: Warning
    reason: FailedScheduling
    mode: automatic                  # Override global mode for this selector
Safety Thresholds
# Global thresholds (used when mode=automatic)
confidenceThreshold: 0.8             # 0.0-1.0, higher = more conservative
maxRiskLevel: low                    # low, medium, or high

# Per-selector override
eventSelectors:
  - type: Warning
    reason: FailedScheduling
    mode: automatic
    confidenceThreshold: 0.9         # Require 90% confidence for this event type
    maxRiskLevel: medium             # Allow medium-risk actions
Other Settings
rateLimiting:
  eventsPerMinute: 10                # Maximum events processed per minute
  cooldownMinutes: 5                 # Wait time after processing an event

persistence:
  enabled: true                      # Persist cooldown state across restarts (default: true)
Notifications
You can configure Slack, Google Chat, or both simultaneously.
# First, create Secrets for your webhook URLs:
# kubectl create secret generic slack-webhook --from-literal=url="https://hooks.slack.com/services/..." --namespace dot-ai
# kubectl create secret generic gchat-webhook --from-literal=url="https://chat.googleapis.com/v1/spaces/..." --namespace dot-ai

notifications:
  # Slack notifications
  slack:
    enabled: true
    webhookUrlSecretRef:             # RECOMMENDED: Use Secret reference
      name: slack-webhook            # Secret name (must be in same namespace)
      key: url                       # Key within the Secret
    channel: "#alerts"
    notifyOnStart: true              # Notify when remediation starts
    notifyOnComplete: true           # Notify when remediation completes
  # Google Chat notifications (requires Google Workspace paid account)
  googleChat:
    enabled: true
    webhookUrlSecretRef:             # RECOMMENDED: Use Secret reference
      name: gchat-webhook            # Secret name (must be in same namespace)
      key: url                       # Key within the Secret
    notifyOnStart: true              # Notify when remediation starts
    notifyOnComplete: true           # Notify when remediation completes
Monitoring RemediationPolicies
View Policy Status
# List all policies
kubectl get remediationpolicies --all-namespaces

# Get detailed status
kubectl get remediationpolicy sample-policy --namespace dot-ai --output yaml

# Watch for updates
kubectl get remediationpolicies --namespace dot-ai --watch
Check Policy Metrics
# View policy status
kubectl get remediationpolicy sample-policy --namespace dot-ai --output jsonpath='{.status}' | jq

# Key metrics:
# - totalEventsProcessed: Total events matched by this policy
# - successfulRemediations: Successful remediation attempts
# - failedRemediations: Failed remediation attempts
# - rateLimitedEvents: Events skipped due to rate limiting
Controller Logs
# View recent logs
kubectl logs --selector app.kubernetes.io/name=dot-ai-controller --namespace dot-ai --tail 50

# Follow logs in real-time
kubectl logs --selector app.kubernetes.io/name=dot-ai-controller --namespace dot-ai --follow

# Search for specific events
kubectl logs --selector app.kubernetes.io/name=dot-ai-controller --namespace dot-ai | grep "FailedScheduling"
Best Practices
Start Conservative
- Begin with manual mode for all events
- Monitor Slack notifications to understand what issues occur
- Gradually enable automatic mode for specific, low-risk event types
- Increase confidence thresholds as you gain trust in the system
Event Selector Ordering
Order selectors from most specific to least specific:
eventSelectors:
  # 1. Specific high-confidence scenarios (automatic)
  - type: Warning
    reason: FailedScheduling
    involvedObjectKind: Pod
    namespace: development
    mode: automatic
    confidenceThreshold: 0.9

  # 2. Broader scenarios (manual)
  - type: Warning
    reason: FailedScheduling
    involvedObjectKind: Pod
    mode: manual

  # 3. Catch-all (manual, low priority)
  - type: Warning
    reason: ""
    mode: manual
Production Safety
For production environments:
spec:
  mode: manual                       # Default to manual for safety
  confidenceThreshold: 0.9           # High confidence required
  maxRiskLevel: low                  # Only low-risk automatic actions
  rateLimiting:
    eventsPerMinute: 3               # Conservative rate limit
    cooldownMinutes: 30              # Long cooldown to prevent storms
Testing Strategy
- Test in development first with automatic mode enabled
- Review Slack notifications for accuracy and usefulness
- Validate automatic remediations work as expected
- Gradually roll out to production starting with manual mode
Troubleshooting
Events Not Being Processed
- Check if policy exists and is in Ready state:
kubectl get remediationpolicy --namespace dot-ai
kubectl describe remediationpolicy sample-policy --namespace dot-ai
- Verify MCP endpoint is accessible:
kubectl get svc --namespace dot-ai
kubectl run test-curl --image=curlimages/curl --rm -it --restart=Never -- curl http://dot-ai-mcp.dot-ai.svc.cluster.local:3456/health
- Check controller logs for errors:
kubectl logs --selector app.kubernetes.io/name=dot-ai-controller --namespace dot-ai --tail 100 | grep -i error
Slack Notifications Not Received
- Verify Secret exists and contains webhook URL:
# Check if Secret exists
kubectl get secret slack-webhook --namespace dot-ai

# Verify Secret contains the url key (webhook URL will be base64 encoded)
kubectl get secret slack-webhook --namespace dot-ai -o jsonpath='{.data.url}' | base64 -d
- Test webhook manually (use decoded URL from step 1):
curl -X POST -H 'Content-type: application/json' \
  --data '{"text":"Test notification"}' \
  YOUR_WEBHOOK_URL
- Check RemediationPolicy references the correct Secret:
kubectl get remediationpolicy sample-policy --namespace dot-ai -o yaml | grep -A2 webhookUrlSecretRef
- Check controller logs for Secret resolution errors:
kubectl logs --selector app.kubernetes.io/name=dot-ai-controller --namespace dot-ai | grep -i "slack\|secret"
- Check NotificationsHealthy status condition:
kubectl describe remediationpolicy sample-policy --namespace dot-ai | grep -A5 "NotificationsHealthy"
Secret Resolution Errors
If you see errors related to Secret resolution in controller logs or status conditions:
Error: "Secret not found"
# Verify the Secret exists in the correct namespace
kubectl get secret slack-webhook --namespace dot-ai

# If missing, create it:
kubectl create secret generic slack-webhook \
  --from-literal=url="https://hooks.slack.com/services/YOUR/WEBHOOK/URL" \
  --namespace dot-ai
Error: "Key not found in Secret"
# Check what keys exist in the Secret
kubectl get secret slack-webhook --namespace dot-ai -o jsonpath='{.data}' | jq 'keys'

# The Secret must contain the key specified in webhookUrlSecretRef.key
# Default key is "url" - ensure your Secret uses this key or update the CR
Error: "Secret must be in the same namespace"
# Secrets must be in the same namespace as the RemediationPolicy CR
# Check RemediationPolicy namespace:
kubectl get remediationpolicy sample-policy --all-namespaces

# Ensure Secret is in the same namespace:
kubectl get secret slack-webhook --namespace dot-ai
Webhook URL is empty or invalid
# Verify the Secret contains a valid URL
kubectl get secret slack-webhook --namespace dot-ai -o jsonpath='{.data.url}' | base64 -d

# Should output a full webhook URL starting with https://
# If empty or malformed, update the Secret:
kubectl create secret generic slack-webhook \
  --from-literal=url="https://hooks.slack.com/services/YOUR/WEBHOOK/URL" \
  --namespace dot-ai \
  --dry-run=client -o yaml | kubectl apply -f -
Rate Limiting Issues
If events are being rate limited:
# Check rate limited count
kubectl get remediationpolicy sample-policy --namespace dot-ai -o jsonpath='{.status.rateLimitedEvents}'

# Adjust rate limits
kubectl patch remediationpolicy sample-policy --namespace dot-ai --type merge -p '
spec:
  rateLimiting:
    eventsPerMinute: 20
    cooldownMinutes: 2
'
Cleanup
Remove test resources:
# Delete test namespaces
kubectl delete namespace memory-demo postgres-demo

# Delete remediation policy
kubectl delete remediationpolicy sample-policy --namespace dot-ai
Next Steps
- Review Solution Guide for resource tracking and lifecycle management
- Learn about Capability Scanning for autonomous capability discovery
- Check Troubleshooting Guide for common issues
- Explore DevOps AI Toolkit for MCP capabilities